This article explains why the financial health of the entire solar photovoltaics (PV) manufacturing segment could now lie in the hands of just two companies; Xinyi Solar Holdings Ltd. (Xinyi) and Flat Glass Group Co., Ltd. (Flat Glass).
The discussion below follows on directly from my previous article on the Terawatt PV Research platform: China PV manufacturing priority in 2025 is cost, not price.
Why are Xinyi and Flat Glass so important?
I mentioned before in the previous post that cost (not price) is the key issue for the PV manufacturing sector in 2025.
Polysilicon pricing is no longer the gating factor to the cost of sales of a PV module and the short-term outlook on poly pricing is essentially flat.
This has promoted glass as the leading contributor to costs in the sector, a factor compounded by the transition to module bifaciality.
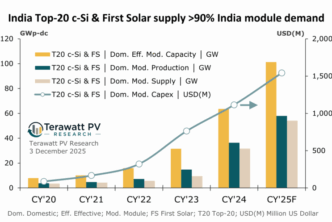
Glass supply to the PV industry is more concentrated than any other manufacturing, equipment or materials segment. Indeed, just two companies (Xinyi and Flat Glass) have a market share of more than 50%. With manufacturing bases in Southeast Asia (in addition to across mainland China), a large percentage of c-Si PV modules used in the U.S. is comprised of glass made by these companies.
Therefore, Xinyi and Flat Glass are possibly the two most important companies in the entire PV manufacturing eco-system globally today.
Can Xinyi and Flat Glass lower glass prices further?
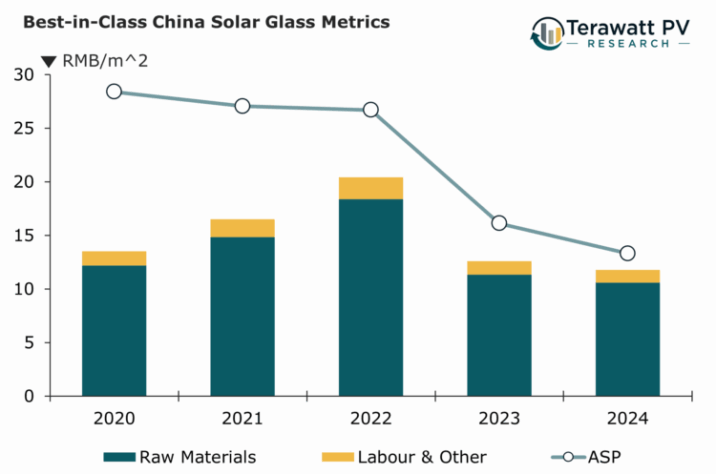
To understand the answer to this question, look at the graph above.
The upper line shows the annual blended solar glass pricing, or ASP, weighted across 2mm and 3.2mm glass thicknesses, but dominated by 2mm today. This ASP is derived from amalgamating the specific solar glass revenues and shipments from Xinyi and Flat Glass over the five-year period from 2020 to 2024.
The bar stack is the cost-of-sales, again amalgamating cost contributions for the two companies, and then segmenting the total to pull out the contribution from raw materials only (dominated by quartz sand, soda ash and fuel).
The reason for this type of analysis is to monitor the delta between the raw materials cost and the final sales price.
Operating with net losses is a natural consequence in any end-market where supply/demand fluctuates and forecasting is challenging. Furthermore, short-term operational losses are generally not a problem for a healthy entity with a return-to-profitability plan. However, selling at below raw (or direct) material costs is not an option, especially when these costs are tied to international prices for basic materials and crude oil, for example.
Now compare the delta in the Raw Materials cost to the ASP for 2020 and 2024. This should lend weight to my comment in the last post that a terawatt scale production industry could be ‘living in a material world’.
Does this provide a reason to be worried?
In short, the answer here is ‘no’, despite revenues streams being dominated by the solar industry for each company.
However, as is the case for all companies in the solar industry during a downturn, the issue is not about quarterly losses: rather, having cash and debt under control, being able to cut costs (potentially more from an operational standpoint) and – most importantly – having a plan to move forward as a more streamlined entity.
The solar industry is full of examples of companies being bailed out of bankruptcy, only to then operate as they did before things went south.
Back to Xinyi and Flat Glass now. Let’s have a look at their operations to the end of 2024.
There are many financial metrics or ratios that could be applied, but probably the quick ratio (or acid test) for liquidity (cash-flow) and debt-to-equity for leverage (exposure to debt financing) are good ones to focus on (coming out of a downturn).
All financial ratios are industry, country and segment specific; so, the main thing is to look for trends that may suggest ongoing issues that could arise should pricing remain at current levels and costs go up (especially for raw materials).
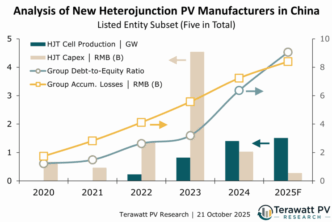
The graph below shows the quick ratio and debt/equity ratio for Xinyi and Flat Glass for the five-year period under review.
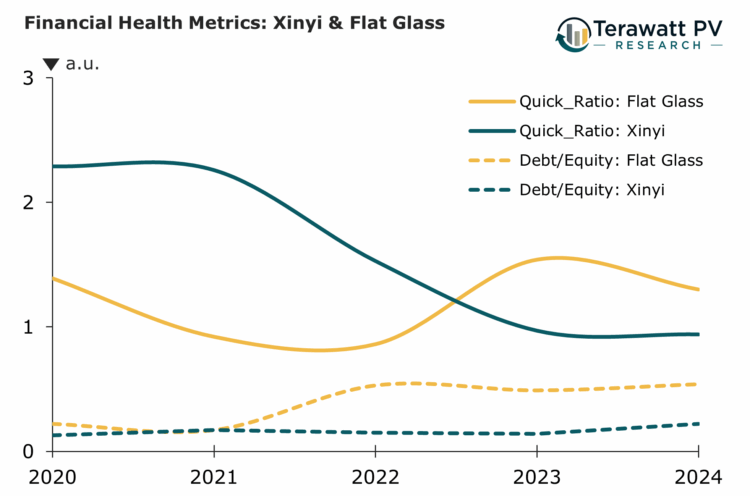
Broadly speaking, the quick ratio trends for both companies are routinely above 1 which is the key number to reference here. Indeed, over the last couple of years and to the end of 2024, there is no suggestion of liquidity being a problem.
The debt-to-equity lines are also nothing to be concerned about. There were no signs of any major increase by the end of 2024, helped in part by both companies scaling back new furnace additions in the second half of the year.
Flat Glass’s metrics are close to industry-leading in the solar industry as a whole and this may turn out important going into 2026 (not to mention through the whole of 2025).
Within a few weeks, the half-year numbers will be available for Xinyi and Flat Glass (in addition to the other key solar glass suppliers). This will be a good indication if margins are stabilizing and some of the idled furnaces have been taken out of cold repair status.
The entire industry should be hoping for this.