Silver prices recently hit a 14-year high on the back of a six-year period of steady growth. Factors driving the uptick in 2025 include safe-haven asset investments, mining output disruptions and demand from the solar PV industry.
Silver powder is the key raw material for manufacturing silver paste, used by c-Si cell producers during the metallization process.
One of the main topics during the preparation for my book-writing project (working title number seventeen – The Era of Terawatt Annual Production) is raw material consumption; how this evolved in the early days of the industry, then became a major drain on global supply, and subsequently panned out as terawatt levels of production got underway.
Advances in cell metallization over the past 15 years have been dramatic, in terms of reducing silver consumption and assisting improvements to cell efficiencies through the various mainstream technologies over this period (multi to mono, BSF to PERC, n-type to p-type, leading to TOPCon as the dominant technology produced today). The consumption of silver fifteen years ago was in the range 50-60 mg/W (some 5X compared to 2024 rates).
As a starting point to this theme (materials consumption by PV) in the book, I decided to do some new analysis of silver materials supply so far this decade. The following section discusses the findings.
Silver paste suppliers’ business models are exemplary
In terms of the methodology used, the underlying data is derived from a new revenue and cost analysis model, focusing on two major silver paste suppliers to the PV industry today, and their key suppliers (specific to silver power) and customers (specific to silver paste). Further inputs are used from the London Bullion Market Association and the Silver Institute. Minor revisions are done to the estimates on PV sector market contributions (done by the supply/commodity-side), owing to the likely use of end-market deployment (as opposed to production) as sourced inputs.
The output consists of three graphs (shown in Figures 1, 2 and 3). Figures 1 and 2 are shown below. Figure 3 forms the introduction caption to this post and is shown at the top.
Figure 1 (below) tracks key metrics from the two leading silver paste suppliers to the PV industry today: Wuxi DK Electronic Materials Co., Ltd. (DKEM) and Changzhou Fusion New Material Co., Ltd. (Fusion). Also included are metrics from these companies’ silver power suppliers and their key customers (cell producers). The full analysis shows results on a RMB/Watt basis, factoring in consumption rates for cell types produced, exchange rates (owing to silver trading internationally), and the prevailing annual blended wafer cost contributions at the cell processing level.
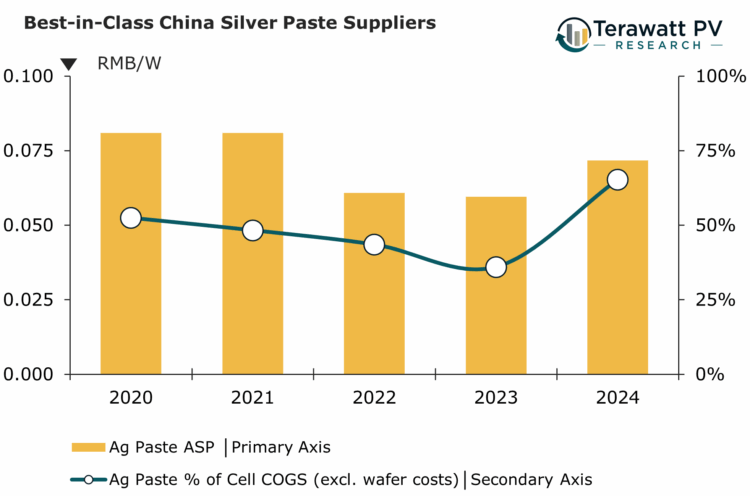
The cost of silver paste to cell producers has been strongly influenced by three factors since 2020: declining consumption rates in production, the transition of mainstream technology from PERC to TOPCon, and the international commodity price of silver.
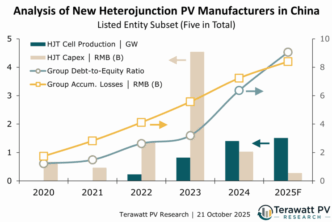
Silver consumption for heterojunction (HJT) cells has been the focus of significant research and media coverage in the past few years. However, HJT has not had any meaningful impact on overall silver consumption until now (owing to minimal market-share contributions).
Therefore, consumption rates are essentially driven by the gradual declines for PERC until 2023 and for TOPCon from 2023. Indeed, during 2024, back-contact consumption (silver specific) started to emerge as the second largest contribution to overall usage.
The net impact (specific to a Chinese cell producer trading in Yuan) was a declining raw material cost contribution from 2021 to 2023 (driven by consumption rate declines on PERC cells), followed by an uptick in 2024 due to the increased production share from TOPCon (with greater mg/W usage compared to PERC) and the uptick in silver pricing.
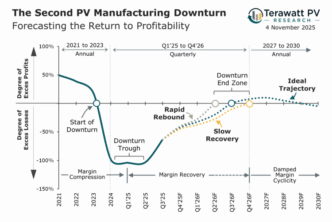
The contribution of silver paste to the processing costs for solar cells (the blue line in the graph above) can be seen to generally follow the changes to silver paste ASPs (as expected), except for the relatively larger uptick in contribution during 2024 (to circa. 65%). This is due to the cyclical nature of the PV industry; specifically, stronger levels of margin compression in the midstream segments (wafers and cells) during a manufacturing downturn.
Looking more closely at margins (Figure 2 below), there are some interesting trends over the past five years.
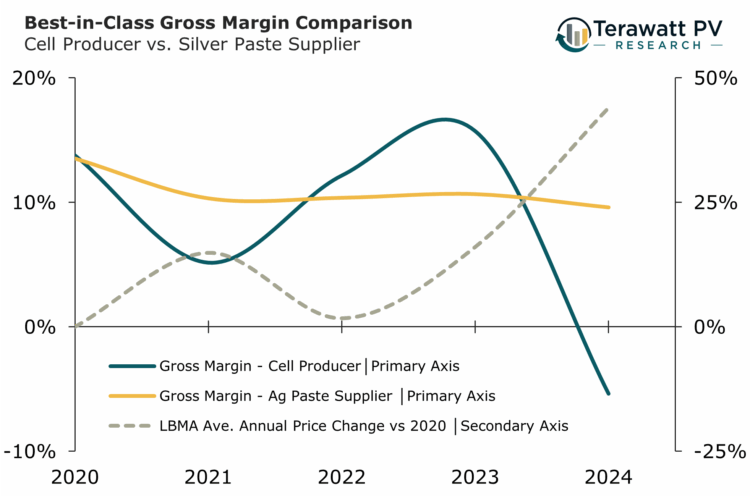
The gross margins for cell production (blue line) can be seen to rise and fall with the declines and upticks, respectively, of the silver pricing. In this graph, starting from 2020 is convenient as the gross margins of both the silver paste suppliers and for cell production are almost identical (circa. 13.5-14%). Therefore, it is possible to look purely at the changes in the silver pricing, relative to 2020, to see how this impacts the changes in margins from both silver supplier and paste user.
The most interesting takeaway from this graph is that the leading silver paste suppliers managed to hold their margins relatively firm (10% plus/minus), despite the volatility in both commodity pricing and the PV manufacturing sector. Whether this ‘exemplary’ modus operandi can be retained in 2025 is yet to be seen; first quarter figures are suggesting minor declines, but full year operation will be the ultimate guide here.
Now, let’s return to the topic that prompted this piece of research – the contribution from the PV industry to overall silver supply.
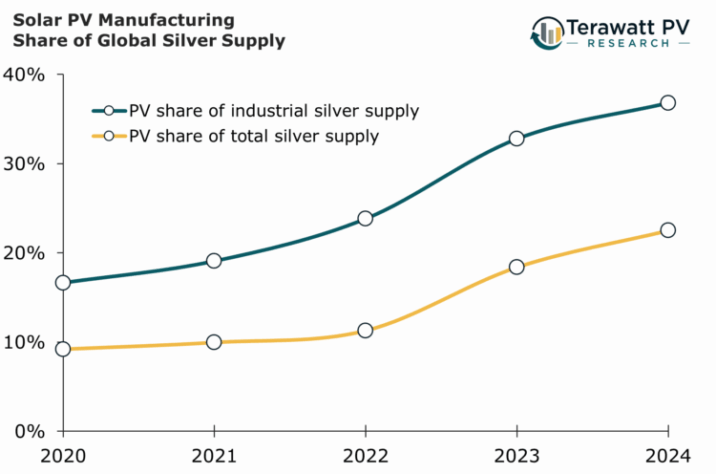
First, it is important to define PV’s role in greater detail. Silver supply is normally segmented into industrial (including electrical and electronics sectors, including solar PV) and non-industrial use (mostly jewellery and investments).
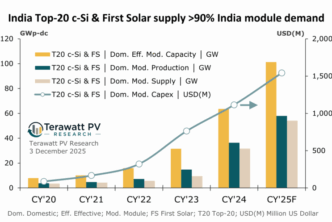
Figure 3 (above, top) shows the solar industry’s steep growth in silver consumption within both the industrial segment of silver supply and the total global silver supply, from 2020 to 2024.
2025 should be the peak in silver usage by the solar industry
Solar industry observers have often suggested that the sector will somehow ‘correct’ itself, thereby avoiding PV’s contribution to global silver supply reaching unacceptably high levels (which many would argue they are already at). And that this will be driven by greatly reducing or eliminating silver usage at the cell production stage (for which there are many working proposals).
While I fully align with this rationale, I tend to think that other factors will naturally drive this change and that it will come much faster than expected, with pure economics and manufacturing profitability being the overarching drivers.
To explain this, let’s imagine a ‘thought experiment’ of sorts. If silver pricing was to spike in pricing, say by 2X, then the argument to move away from silver would be purely economical, not based on moral grounds (excessive silver usage), and not based on the expectation that iterative reductions in consumption could quickly allow the cost-competitiveness of silver in cell manufacturing to be restored.
Silver (screen-printed) is certainly not the only game in town; there are plenty of alternatives and many of them have performance benefits. The historic use of screen-printed silver paste – and how this dominated the solar industry in its drive to TW-scale production – seems for now a nice working title for one of the book’s chapters; and this could end up merely as a transient theme, characteristic of the pre-TW era of PV production, that is reviewed in years to come.
Technology could also play a key part in the short-term; in particular, if the period 2026 to 2030 does end up being the final phase of single-junction cell optimization. More specifically, this means the sector playing out as I imagine, with back-contact cells being the mainstream offering by 2028 and heterojunction 2.0 retaining niche status (similar to the second part of Sanyo’s heterojunction 1.0 play).
Moving to back-contact cells (hybrid or full back-contact variants), also from a mainstream perspective, may offer the solar industry the best opportunity to finally introduce new tools and materials, and this could start in earnest in 2026.
This could provide a much-needed silver lining for the solar industry in more ways than one, as it exits the downturn next year.